Tool silos
Every scanner speaks a different schema, making cross-tool prioritization slow and inconsistent.
SIH 2026 · PS 26105 · AICTE Cyber Security Cell
RiskForge AI converts fragmented security findings into explainable business risk, probable financial exposure, and an optimized security investment plan—so a CISO can decide what to fix first and show why.
01 — The current problem
Most security workflows end at a severity label: 37 critical, 142 high, hundreds more waiting. That describes technical urgency, but not the asset at stake, likely disruption, regulatory exposure, or the best use of a limited budget.
Every scanner speaks a different schema, making cross-tool prioritization slow and inconsistent.
A lower-CVSS issue on a revenue-critical public asset can outrank a severe lab finding.
Loss is a distribution, not one guaranteed number. Tail outcomes matter to reserves and governance.
A list of recommendations does not prove which combination produces the most risk reduction.
02 — Global scale & India context
These datasets use different populations and methods; they are evidence of scale, not values to be added together. RiskForge uses the same discipline internally: observed facts, assumptions, calculations and AI narrative stay distinguishable.
IBM’s 2025 study reported a 9% year-over-year decline, while showing that faster identification and containment changes the financial outcome.
IBM, 2025 ↗Verizon’s 2025 DBIR analyzed 12,195 confirmed breaches; ransomware presence rose 37% from the prior report.
Verizon DBIR, 2025 ↗The DBIR figure doubled year over year, making vendor and dependency exposure a board-level risk variable.
Verizon infographic ↗The FBI received 1,008,597 complaints in 2025—reported losses were 26% higher than 2024.
FBI IC3, 2025 ↗Context note: FBI and India figures are complaint-based and reflect reported losses; IBM is a sampled organizational cost study; Verizon is a contributed incident/breach dataset. They answer different questions.
03 — Product objective & boundaries
RiskForge accelerates analysts and decision-makers; it does not replace scanners, finance owners, control owners, auditors, or accountable executive judgement.
Normalize heterogeneous findings into one canonical, scanner-independent record.
Enrich findings with asset criticality, exposure, business dependency and threat activity.
Calculate an explainable risk score, annual probability and INR expected loss.
Model uncertainty with P50, VaR 95%, CVaR 95%, VaR 99% and a loss distribution.
Simulate controls before purchase and compare baseline versus residual exposure.
Optimize a control portfolio under a budget and expose assumptions and provenance.
04 — The current implemented flow
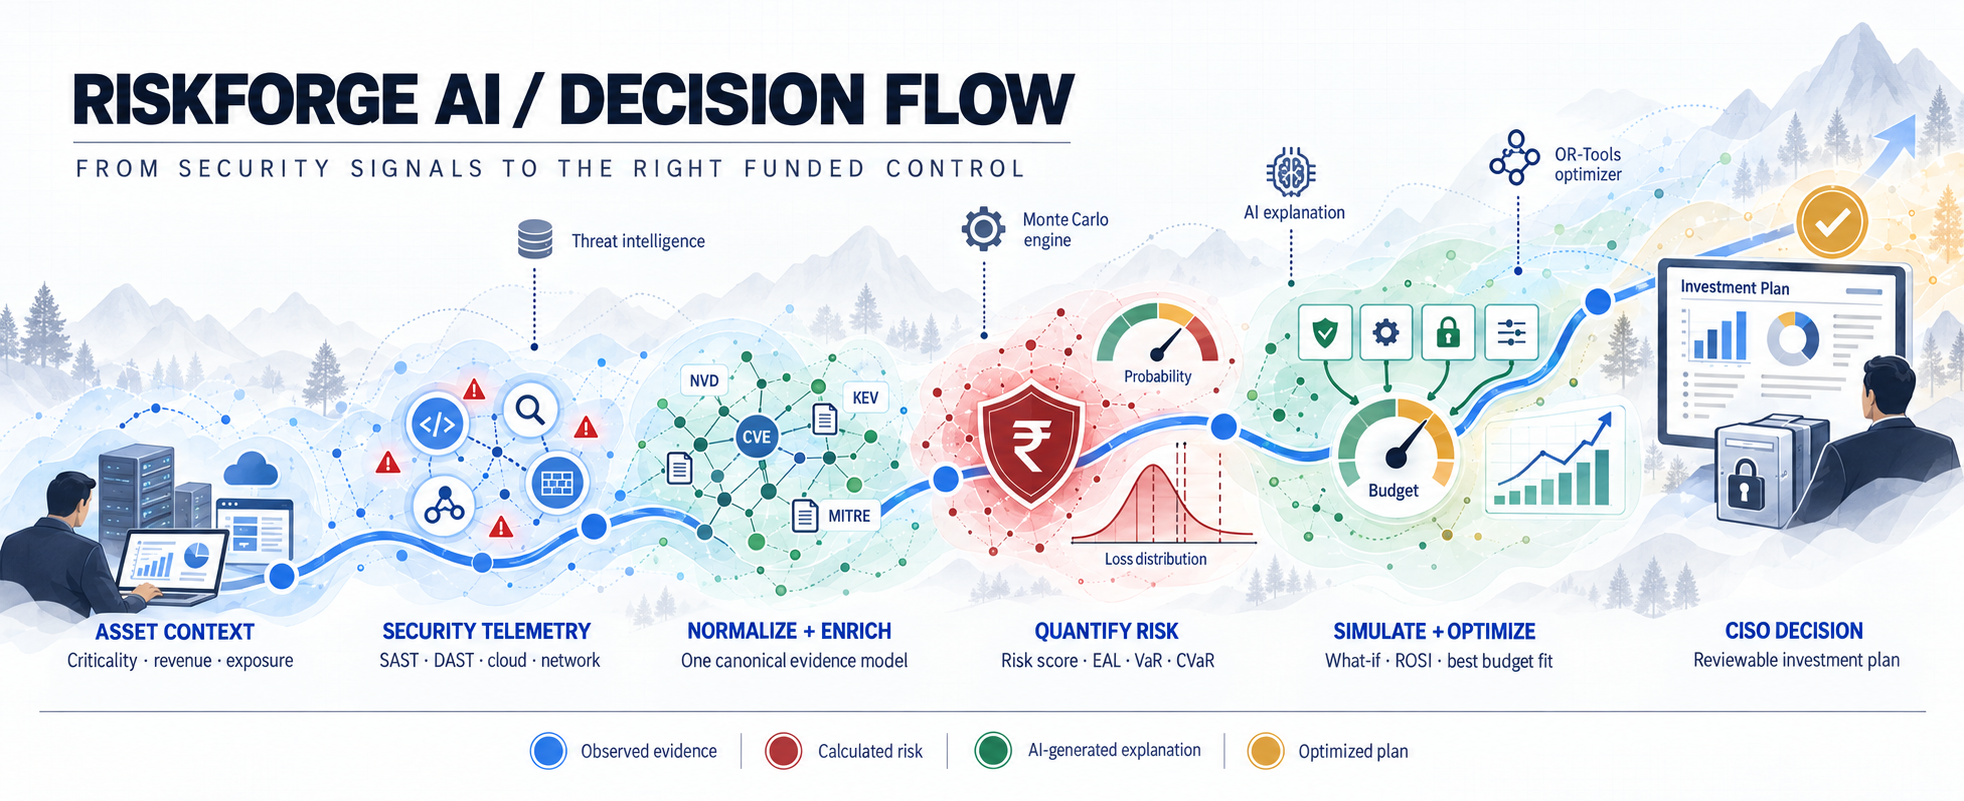
This sequence reflects the implemented backend and UI contract. The asset’s business context must be saved before scoring; otherwise technical findings cannot be translated into meaningful rupee exposure.
05 — System architecture
Scanner-specific logic stops at normalization. The risk engine only consumes canonical findings, which keeps new integrations modular and prevents a tool’s schema from leaking into business calculations.
06 — Quantitative & AI intelligence
Quantitative engines decide the numbers; generative AI explains them. That separation is RiskForge’s central trust control.
Weights technical severity, asset criticality, exposure, exploitability, threat activity and business impact. Existing controls reduce relevant dimensions before the final score is stored.
Maps score to conservative annual probability, boosts known exploitation, decomposes impact and samples uncertain outcomes. Portfolio EL remains analytically consistent; VaR/CVaR come from simulation.
Uses the platform’s factual inputs and calculated outputs to write explanations and proposed actions. Provider adapters support multiple LLMs, but none may create CVSS, EAL, VaR or optimizer selections.
07 — One finding, followed end to end
The visual below shows the product’s mental model. It is not a promise of exact loss; every monetary output depends on recorded business assumptions and versioned model logic.
08 — Related news / business impact
MARKS & SPENCER · APRIL 2025M&S said it paused orders through UK & Ireland websites and apps while managing the incident. In its full-year results, the retailer estimated an approximately £300 million impact on group operating profit before mitigation, with management actions, insurance and cost control expected to reduce the final effect.
A severity score alone cannot express paused digital sales, disruption duration, response cost, insurance offsets or dependency on one service. RiskForge’s asset context and loss decomposition are designed to put those variables beside the technical finding before controls compete for budget.
09 — Previous incidents & recurring loss patterns
Past cases show why cyber exposure must combine customer harm, disruption, recovery, legal/regulatory cost and the business criticality of the affected service.
The FTC said Equifax agreed to pay at least $575 million and potentially up to $700 million to settle allegations that it failed to take reasonable steps to secure its network.
FTC case record ↗MGM estimated a roughly $100 million negative impact to Adjusted Property EBITDAR from the September cybersecurity incident, turning operational downtime into a disclosed financial event.
SEC Form 8-K ↗UnitedHealth reported direct response costs and Optum Insight business disruption, plus more than $9 billion in provider funding support—evidence of systemic third-party and service-dependency risk.
UnitedHealth 2024 Form 10-K ↗Incident scopes and accounting treatments differ. Values are shown as reported by the linked primary source, not normalized or summed.
10 — What the decision-maker receives
Every view should make the next question easier: what drives the risk, how uncertain is it, which control changes it, and what fits the approved budget?
Normalized findings ranked with asset, threat, business and compliance context—not CVSS alone.
Operational and regulatory expected loss, P50, VaR 95%, CVaR 95%, VaR 99% and distribution.
Baseline versus residual risk after selected controls, with visible assumptions and deltas.
Optimized control set, total cost, remaining budget, risk reduction, scoped loss reduction and ROSI.
11 — Project modules & deliverables
12 — Stack, implementation status & limits
13 — Research & implementation sources
External figures link to research, regulators or primary company filings. Product details describe the current implemented prototype and its stated limitations.